| Menu Options | 
The main menu for the Summary of Business application contains seven tabs: - Home
- Summary of Business
- Report Generator
- Prepared Reports
- Historical Reports
- Help
Descriptions of each are in the table below. When you click any tab, a breadcrumb trail appears on the line below for navigating back to a previous screen. |  | The Home tab, or link on the breadcrumb, displays the 'RMA Home Page', which contains a link to the 'Summary of Business Reports and Data' page. |  | The Summary of Business tab displays the landing page for the application. If an Alert message has been created, it appears near the top. Near the bottom is a link to provide feeback to the 'RMA – SummaryOfBusiness Feedback' mailbox. 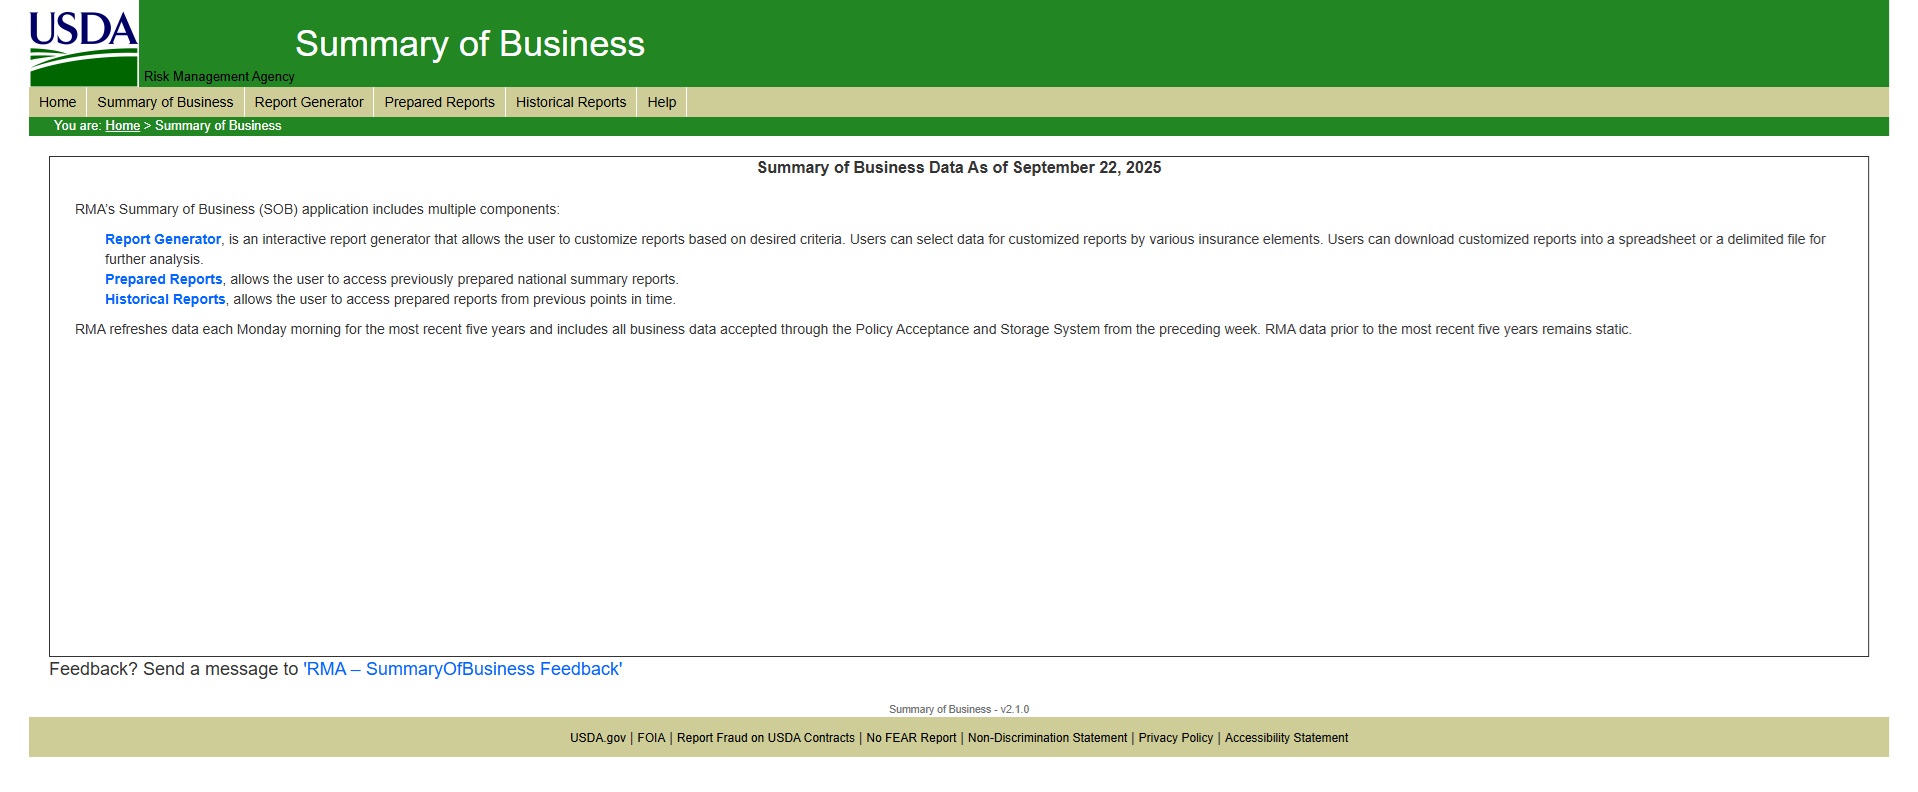
|  | The Report Generator tab displays the selection criteria for creating a report for Standard commodities, Livestock, or Both. See the Report Generator help topic for instructions. |  | The Prepared Reports tab enables you to select reports with specific columns and fields. See the Prepared Reports help topic for instructions. |  | The Historical Reports tab enables you to select a date for a specific report from a past date. You have a choice of National Reports or Current Week. |  | The Help tab allows you to learn information about each function of the application. |
|
| Report Generator |  The Report Generator displays three panels: The Report Generator displays three panels: - The left panel shows the types of data you can select — Commodity Category, Year Type, and Summary Levels.
- Use the Plus and Minus signs to toggle between expanding and collapsing the criteria selections.

- The center panel shows the Report Criteria. Items that you select from the left column display in the center panel.
- The right panel displays the Critera Summary as you select items from the center panel.
| | Left Panel |  - Use the Plus icon to show or hide the details under Commodity Category, Year Type, and Summary Levels in the left panel.
- Use the Select All button to include all types of available data in your report.
- Use the Reset button to clear your selections.
- Use the Get Report button to generate a report showing the data you selected.
| | Center Panel |  - As you select items from the left panel, they appear in the center panel under Report Criteria. You can select items in any order and each selection limits the available choices in the other filters. For example, if you pick Avocados in the Commodity filter and then click the State filter, only those states that offer Avocadoes can be selected. (See screen shot of the right panel.)
- To reorder your criteria, drag the filter bars into the hierarchy you want the report to display. For example, the default shows the year in the first position; however, if you want commodity to be in the first position, drag the Commodity bar up to the top of the center panel.
- Click each filter bar to see the details available for selection. Each filter bar has checkboxes you can use to choose data for your report. Each filter bar also has an All button you can use to include every possible item and a None button to clear your selections.
| | Right Panel | 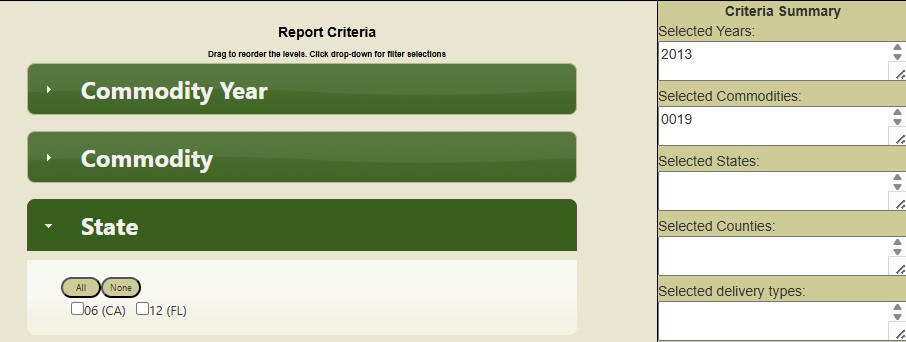 - As you choose data in the filter bars of the center panel, the items you pick display in the right panel in the Criteria Summary.
- If you click the All button, the word "All" displays on the right.
- If you click the None button, the words "None Selected" appear in the right panel.
| | Show Report |  After you click the Get Report button in the left panel, the generated report displays across the screen. After you click the Get Report button in the left panel, the generated report displays across the screen. - Use the horizontal scroll bar at the bottom of the screen to view the entire report.
- The number of rows in the report displays in the lower right corner of the screen. For example, in the report shown here, the result says "1-2 of 2 items"
- If the report is longer than the screen, use the vertical scroll arrow to view the data.
- If the report contains more than one page, use the arrows at the bottom left to display additional pages.
- Use the Review Selection button in the left panel to modify your criteria for the report.
- You can collapse the left panel to spread the report across the entire width of the screen.
| | Export to Excel, Export to File, Share Link |  - Use the Export to Excel icon on the top right if you want to capture the data on your report in a spreadsheet.
- A message displays: "Do you want to open or save?" The message includes the filename, the size, and the server name. Buttons for Open, Save, and Cancel allow you options to look at the file, choose the location for saving it, change the filename, or escape from any of the actions.
- Use the Export to File icon to save the data to a text (.txt) file.
- Use the Link icon to share a link for this content.
- A pop-up window for the Share Link function provides a URL that you can save or send. Press the Close button to exit the pop-up window.

|
|
| Prepared Reports | 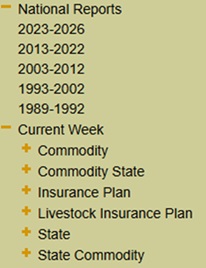
The Prepared Reports screen displays a list of the reports you can select. - Use the Plus icon to show or hide details in the list.
- Click a report name in the list on the left to display it on the screen.
| | Sample Report | 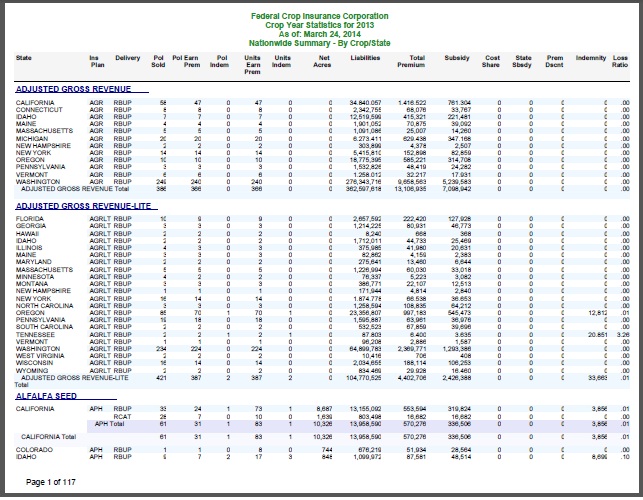 - The displayed report is a PDF (portable data format) file that you can save or print, using the controls.
- The number of pages shows at the bottom left. Use the vertical scroll bar to scan through the pages.
|
|
| Historical Reports | 
The Historical Reports menu in the left panel allows you to choose a date for the report you want to see. The available reports are similar to the Prepared Reports. - Use the dropdown box to select a date, and click the Refresh button to change the report date.
- Use the Plus icon to expand or hide the menu items.
| | Sample Report |  This shows an example of a Historical Report for Commodity using a prior date. |
|